Distribution of nitrate concentrations in public drinking water in Germany and Austria
Background
Various American studies have found evidence of an increased risk of colon cancer and thyroid disease as well as birth defects - cleft palate and spina bifida - in newborns whose mothers drank drinking water with nitrate levels of more than 22-24 mg/l (5-6 mg/l NO3-N) during pregnancy.
A recent case-control study from Spain and Italy showed that the higher the intake of nitrate from drinking water, the higher the risk of colon and colorectal cancer, even at levels far below the limit permitted for drinking water.
Another recent study by Dr Jörg Schullehner from the University of Aarhus in Denmark with around 1.7 million participants over a period of more than 30 years (1978 - 2011) found a direct link between the risk of developing colon cancer and the nitrate content of drinking water: participants who were exposed to more than 16 mg/l nitrate over the entire period of the study had an almost 20 per cent higher risk of colon cancer than those who had ingested less than 0.7 mg/l nitrate via their drinking water.
The study was able to prove a significant increase in the risk of developing colorectal cancer (CRC) from a value of 3.87 mg nitrate per litre.
The authors of the study emphasise that it is particularly worrying that an increase in risk was already recorded at nitrate concentrations that are well below the legally prescribed limits, which is why it makes sense to consider reducing the drinking water limits, regardless of the fact that the issue requires further studies.
We want to take a first step in this direction with this study, based on the drinking water information stored in our database, as an example for Germany and Austria.
What data have we used
Under the German and Austrian Drinking Water Ordinance, water supply companies are obliged to carry out microbiological and chemical tests on drinking water regularly, but at least once a year, and to provide consumers with suitable and up-to-date information material on the quality of the drinking water provided, either in writing or on a notice board, at least once a year. The vast majority of towns and municipalities also comply with this information obligation and publish this data on the Internet. In Austria, nitrate is explicitly mentioned as a parameter about which information must be provided, but not in Germany.
Data reference
In Germany, at the time of the study, there was no central, nationwide centre for the provision of drinking water analyses; in Austria, there was a voluntary drinking water database, which is, however, incomplete and contains some outdated data.
We therefore searched the websites of the individual municipalities by postcode, looked for the publicly accessible drinking water analyses there and transferred the nitrate values, among other things, to our database. If we found different analyses for a supply area that did not correspond to the respective postcode regions, we created our own polygon regions in GIS software and stored them in our database with the corresponding analysis data.
In order to keep our database up to date, we check the entire database at regular intervals and update the values if necessary. This enables us to ensure that only data from 2018 or 2019 was used on the reporting date of this study.
As we have data from the past 3 years, we can see that the drinking water values have changed very little over this period and that this change should not play a distorting role for the period under investigation.
Consideration of different information periods of the water suppliers
The obligation of water suppliers to carry out regular analyses depends on the volume of water supplied or produced in a water supply area. In Germany, small water suppliers are only obliged to publish the data of interest to us (Group B parameters) annually if they supply 10 cubic metres of water per day or more; in Austria, this applies to all water suppliers.
Nevertheless, during our research we have found data from smaller water suppliers in particular that dates back more than a year. We have nevertheless included this data in our database but marked it as 'old'. This accounts for around 7% of the database and this data was not used for this study.
As nitrate is not explicitly mentioned as a parameter to be published in Germany, some smaller water suppliers only publish the water hardness or other analysis values, but not the nitrate content. We also found analyses in Austria that did not publish a nitrate value. These were a total of 695 data records that we were unable to use.
If minimum and maximum values were given in the analyses, we used the maximum values in our database if the difference between the minimum and maximum was less than 4 mg/l. If the difference was greater, we used both values but did not use them for the analysis. In the case of larger differences, we adopted both values but did not use this data for the analysis. Some water suppliers state that the published values represent annual averages, others publish the complete analysis with sample date. We made no distinction when recording the data and did not label the data sets accordingly. We thus had a total of 7,522 data records (out of a total of 8,947) available for Germany and Austria.
Allocation of population figures to the water supply zones
We have broken down our database by postcode region rather than by water supplier supply zone, as this makes it very easy to break down completeness using the lists of postcode regions. There are also population statistics for most European countries that are broken down by municipality and postcode. This allows us to indicate relatively precisely how many people have access to which water. We have not broken it down by individual water suppliers.
We have also not taken into account the proportion of the population who are not connected to the public water network and obtain their water from their own wells. In Germany, this affects around 1% of the population, in Austria around 10%.
There is a corresponding data set for Germany (Population -> Postcode regions) based on the 2011 census under the Open Database Licence. Unfortunately, the Federal Statistical Office does not offer updated data relating to the postcode regions. For Austria, Statistik Austria offers the possibility of acquiring an up-to-date CSV file. For our data, we have licensed the current status of the 2018 population statistics.
There is uncertainty in the allocation of population figures where we have created our own poligones that differ from the postcode regions. If a self-defined service region covers several postcode areas, as is the case in many large cities, we can allocate the corresponding population figures of the postcode regions relatively well. Only in peripheral areas, where the border runs through the centre of a postcode area, are there naturally inaccuracies, which we have tried to compensate for with different allocations.
The situation is different in rural regions where one postcode area (one municipality) has several different service zones. In this case, we can only provide the population figures for the entire municipality; a breakdown by individual districts or parts of the municipality would only be possible by contacting the respective municipality and was not possible due to time constraints.
The largest supply region in Germany is Munich, where the entire urban area with almost 1.5 million inhabitants is supplied with a standardised water supply. The second largest region comprises the city of Düsseldorf, which is supplied with standardised water together with Mettmann (around 660,000 inhabitants), as well as the left bank of the Rhine in Cologne. Here, over 600,000 inhabitants are also supplied with the same water.
In Austria, Vienna is the largest supply area with the first high-level spring pipeline, which supplies around 1 million inhabitants with drinking water.
One of the smallest supply zones with around 460 inhabitants is Dorndiel, a district of Groß-Umstadt in Hesse/Germany. In Austria, Heinrichsdorf with less than 100 inhabitants is one of the smallest supply zones that we currently have in our database.
Population figures taken into account for the study
In total, we used data for 57.6 million people, 51.7 million in Germany and 5.8 million in Austria. A more detailed breakdown of the German data by northern, eastern, western and southern Germany is summarised in the following table. The exact breakdown is based on the German federal states, but deviates from this for reasons of simplification when allocating the postcode regions relevant to us in some border regions:
| North | East | South | West | Austria | |
|---|---|---|---|---|---|
| 5 mg | 7.898.673 | 3.129.263 | 1.848.972 | 3.173.070 | 1.477.609 |
| 10 mg | 1.977.638 | 1.957.471 | 4.523.785 | 5.126.000 | 2.988.807 |
| 15 mg | 514.821 | 1.189.469 | 2.079.704 | 5.171.113 | 462.305 |
| 20 mg | 100.959 | 545.480 | 1.064.579 | 4.107.945 | 396.199 |
| 25 mg | 83.916 | 159.693 | 1.508.795 | 2.398.883 | 234.979 |
| 30 mg | 187.442 | 28.927 | 410.167 | 884.461 | 188.857 |
| 35 mg | 52.713 | 86.620 | 174.542 | 484.048 | 83.013 |
| 40 mg | 21.804 | 4.183 | 151.223 | 270.439 | 2.929 |
| 45 mg | 50.085 | 34.897 | 285.073 | 13.125 | |
| 50 mg | 9.037 | 66.360 | 4.788 | ||
| Total | 10.888.051 | 7.110.143 | 11.796.664 | 21.967.392 | 5.852.611 |
| Total | 51.770.810 | 5.852.611 | |||
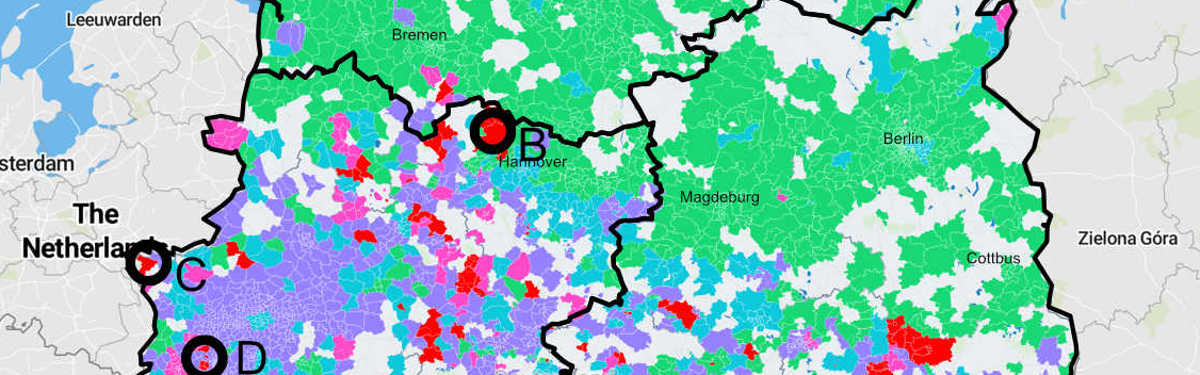
Visualisation of different nitrate concentrations in drinking water 2018/19
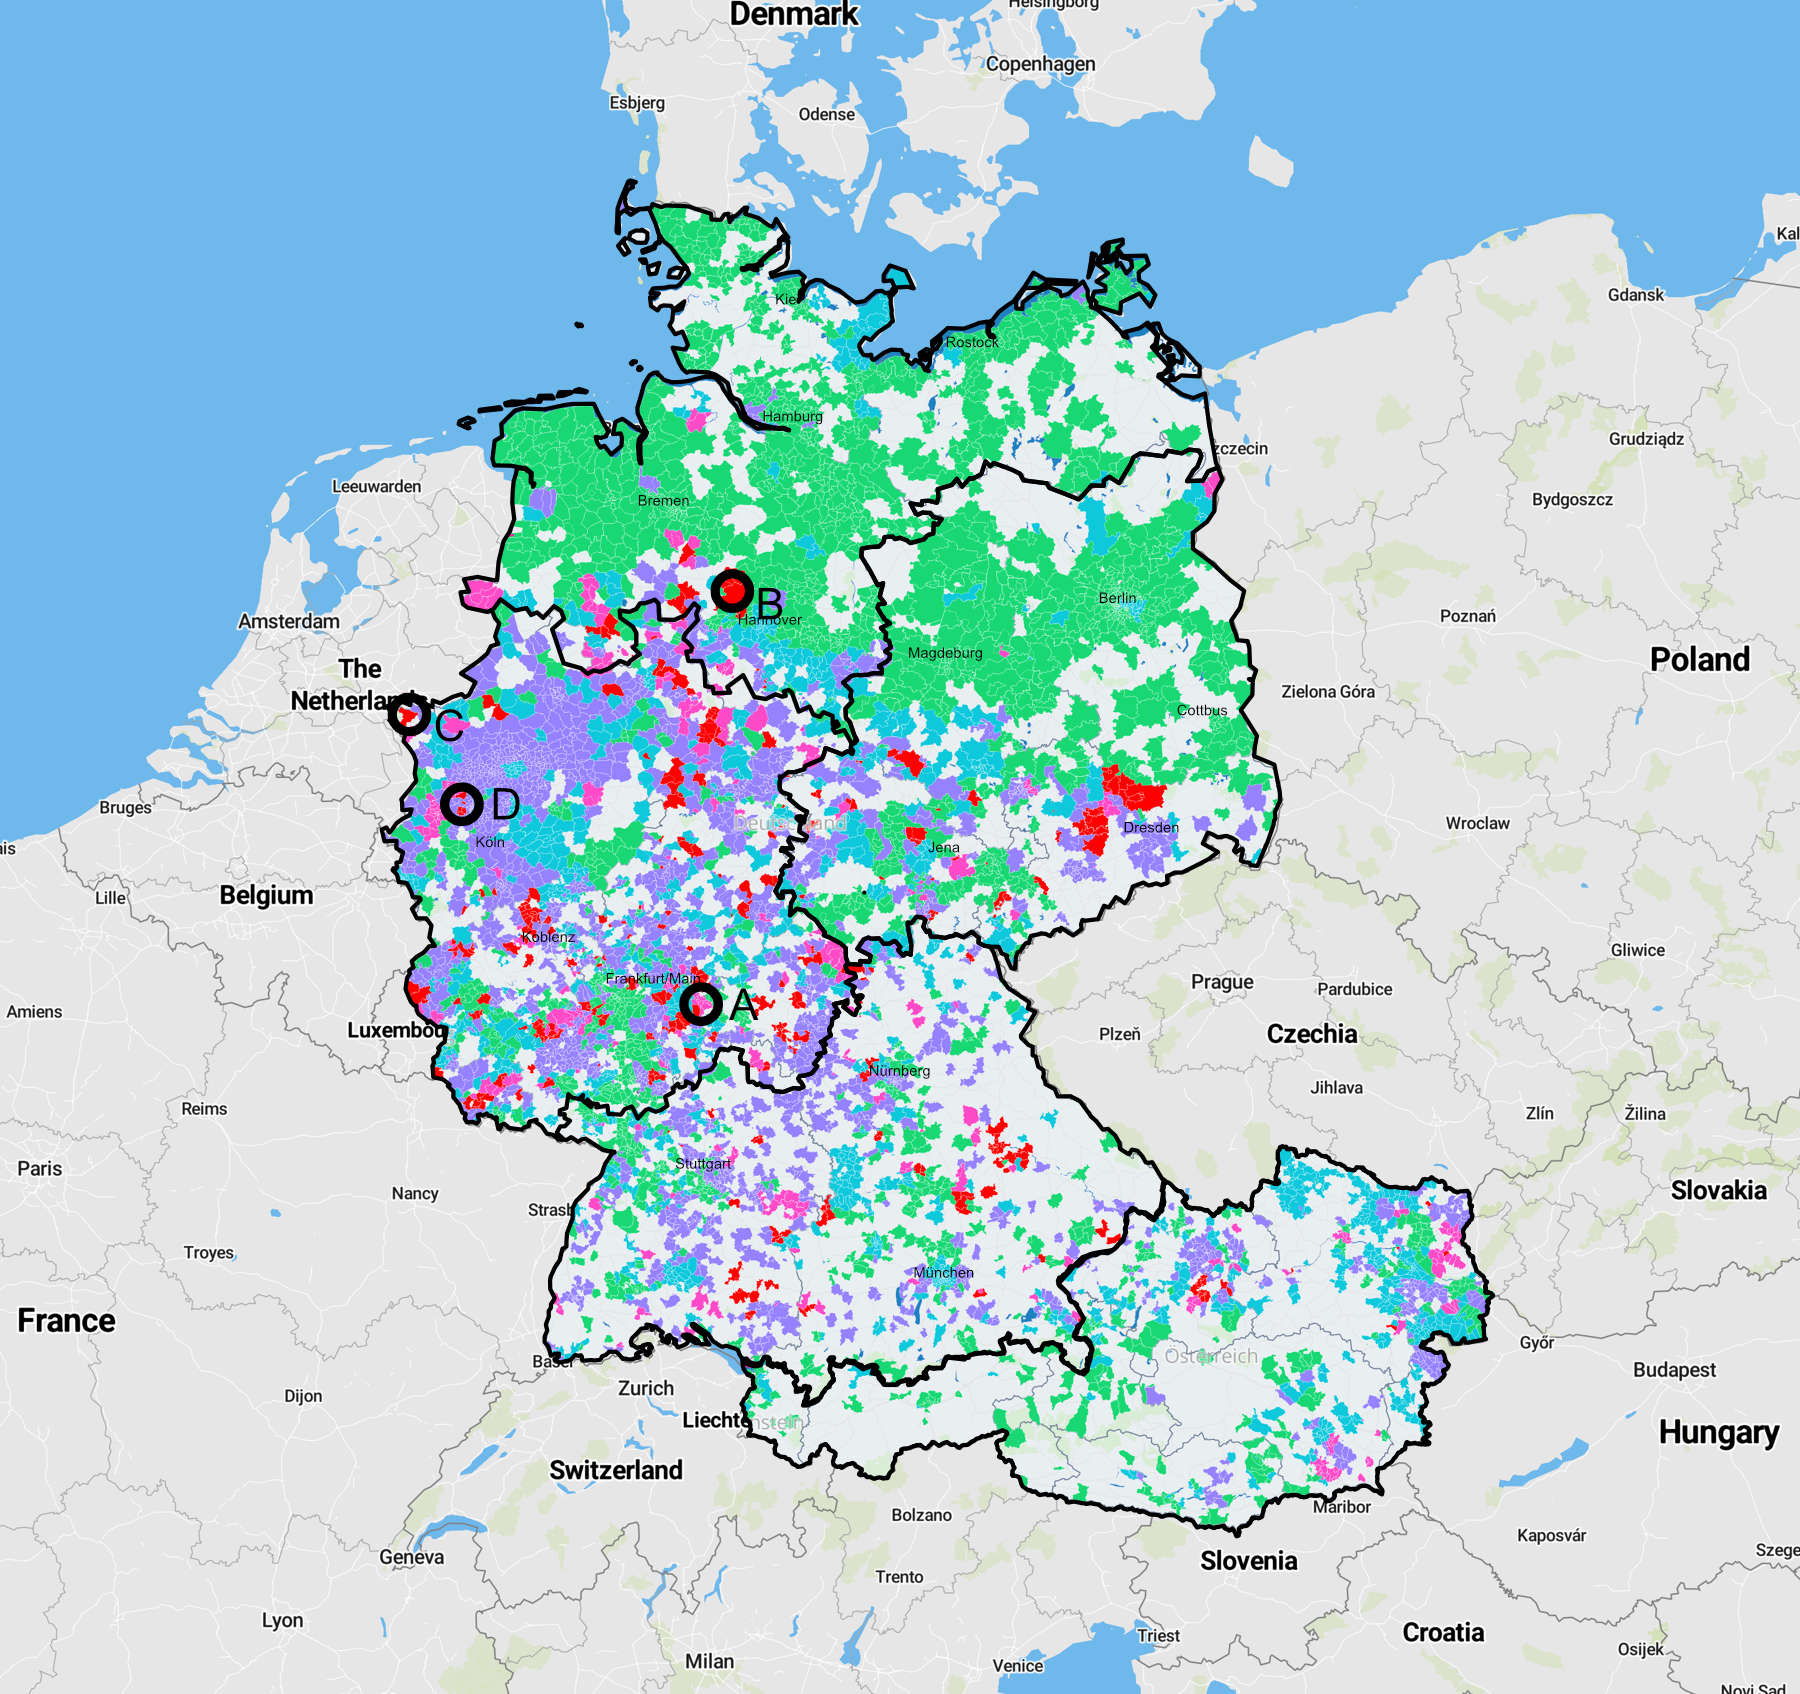
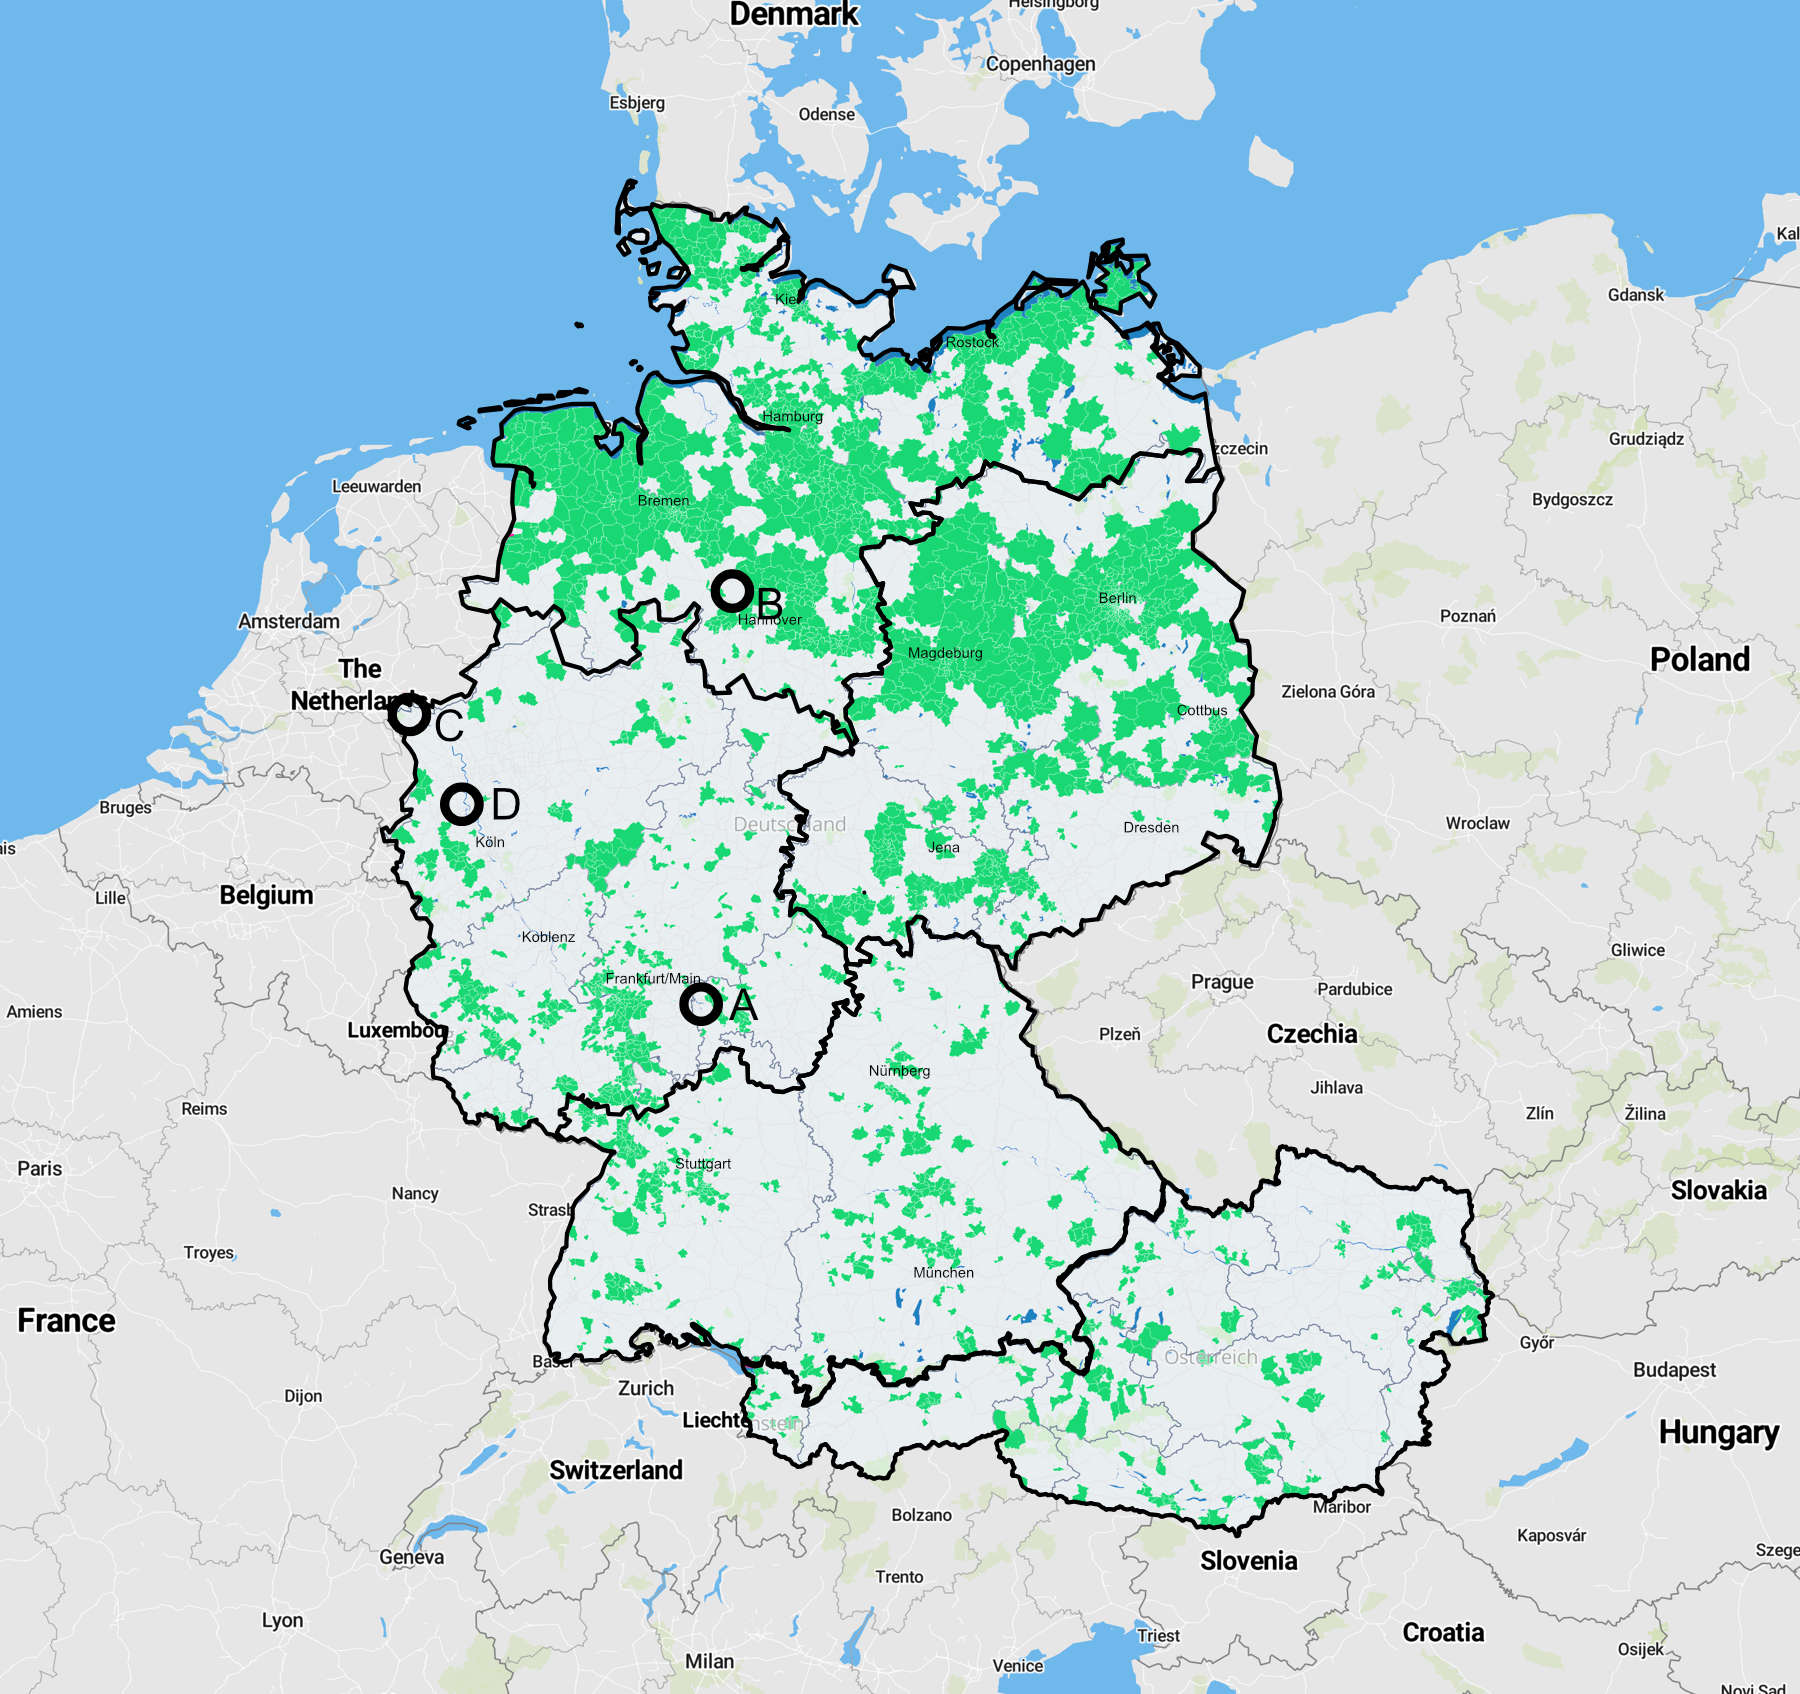
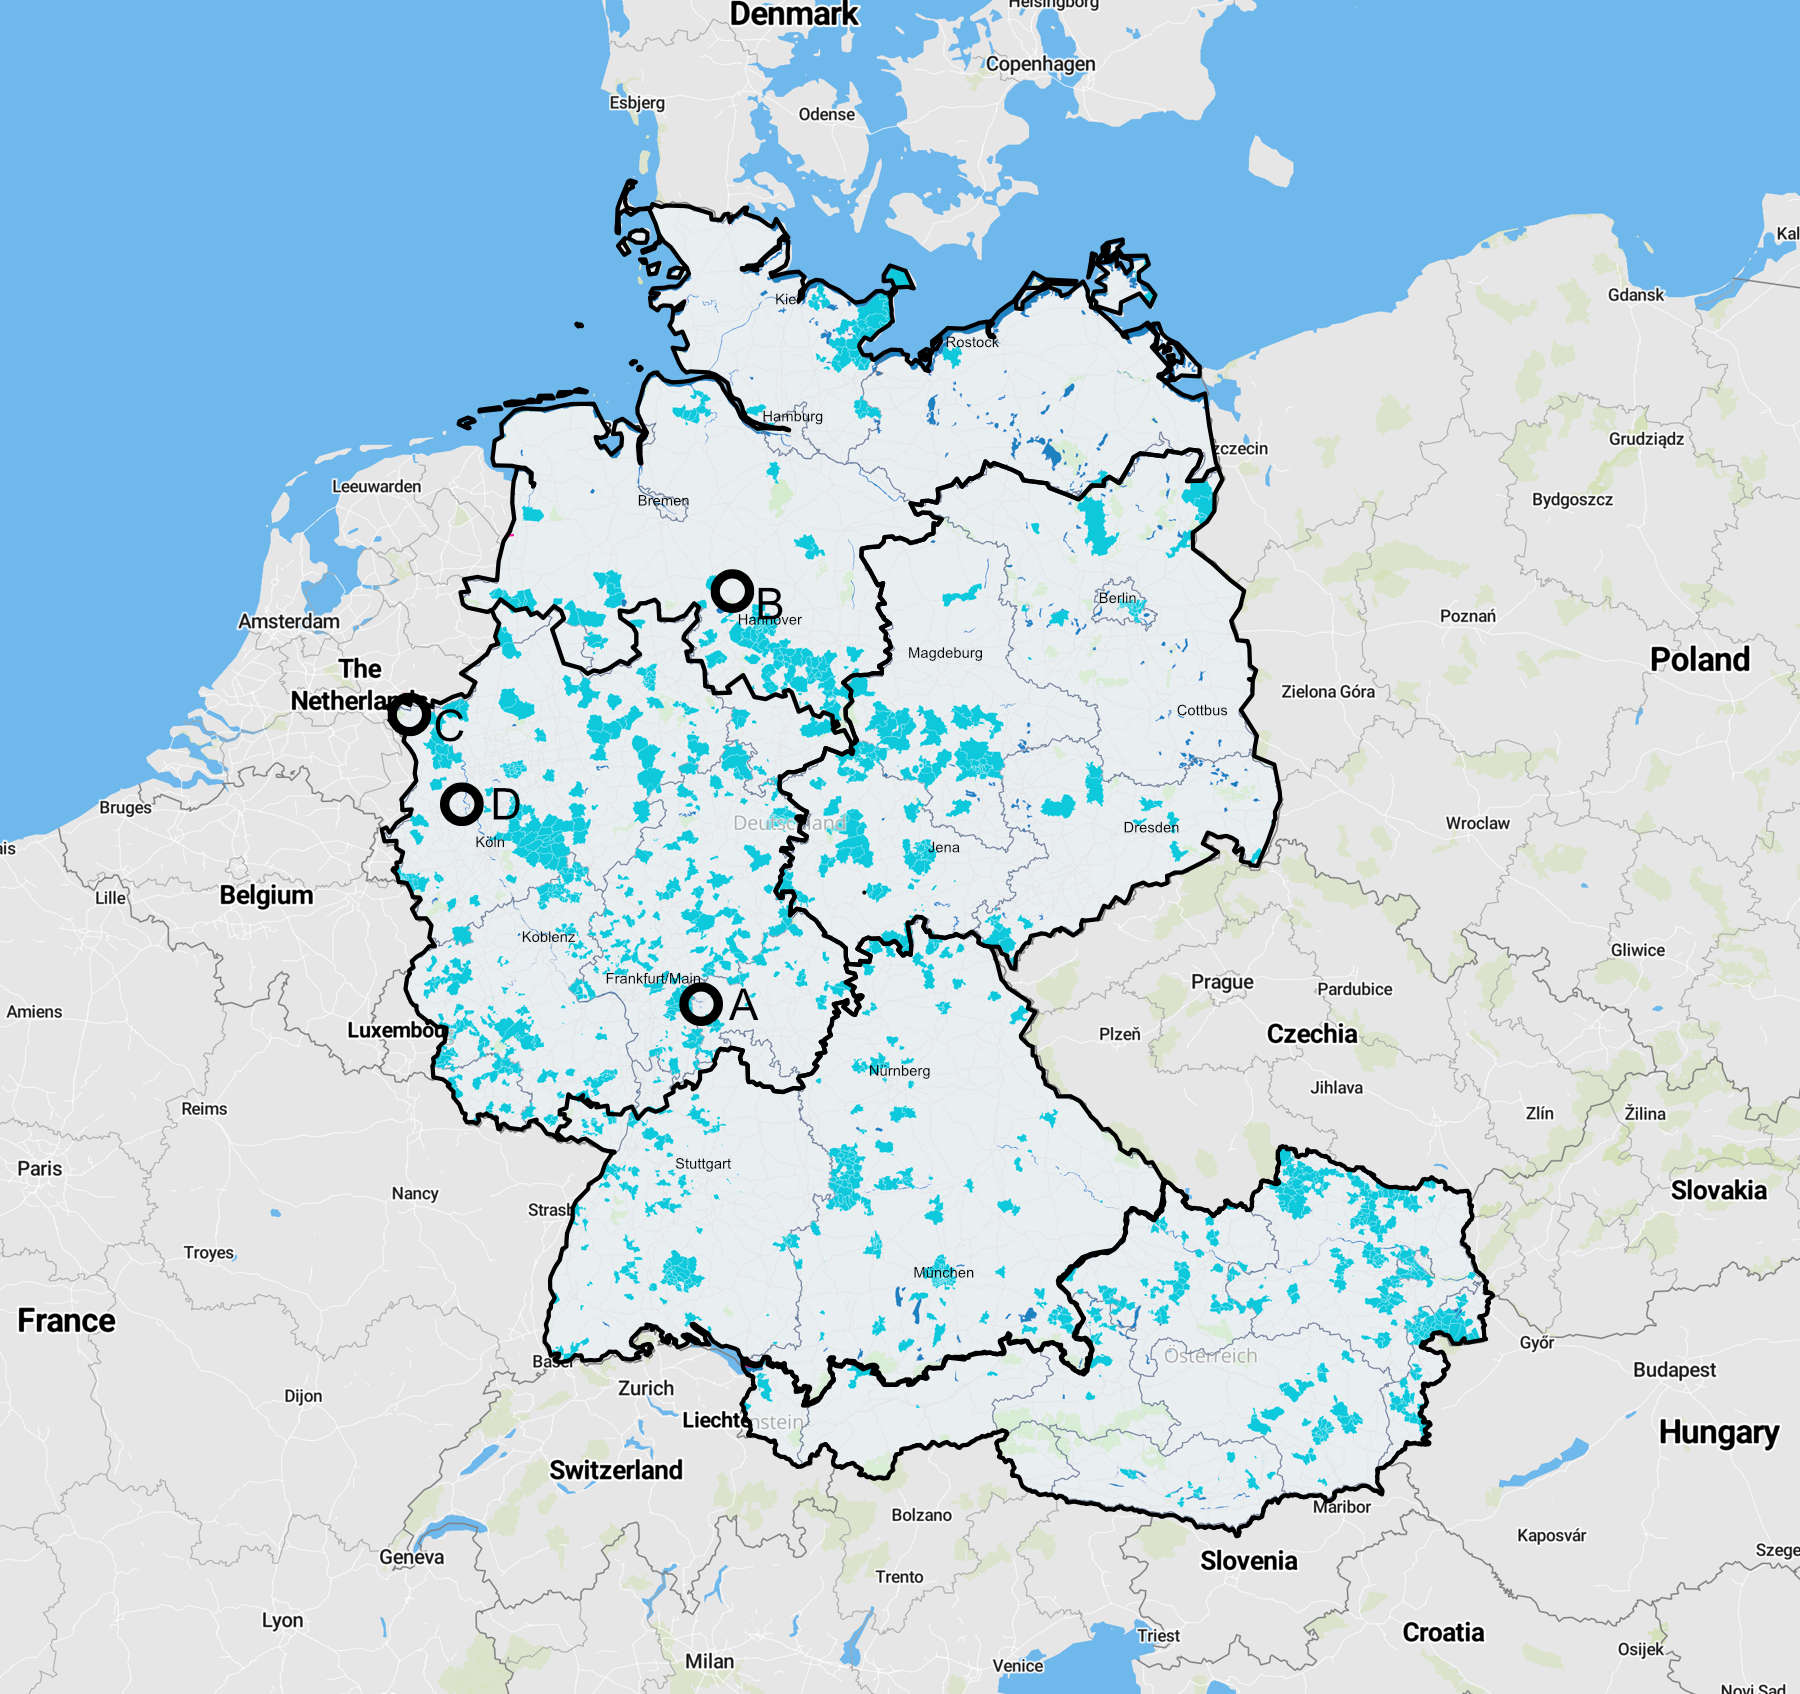
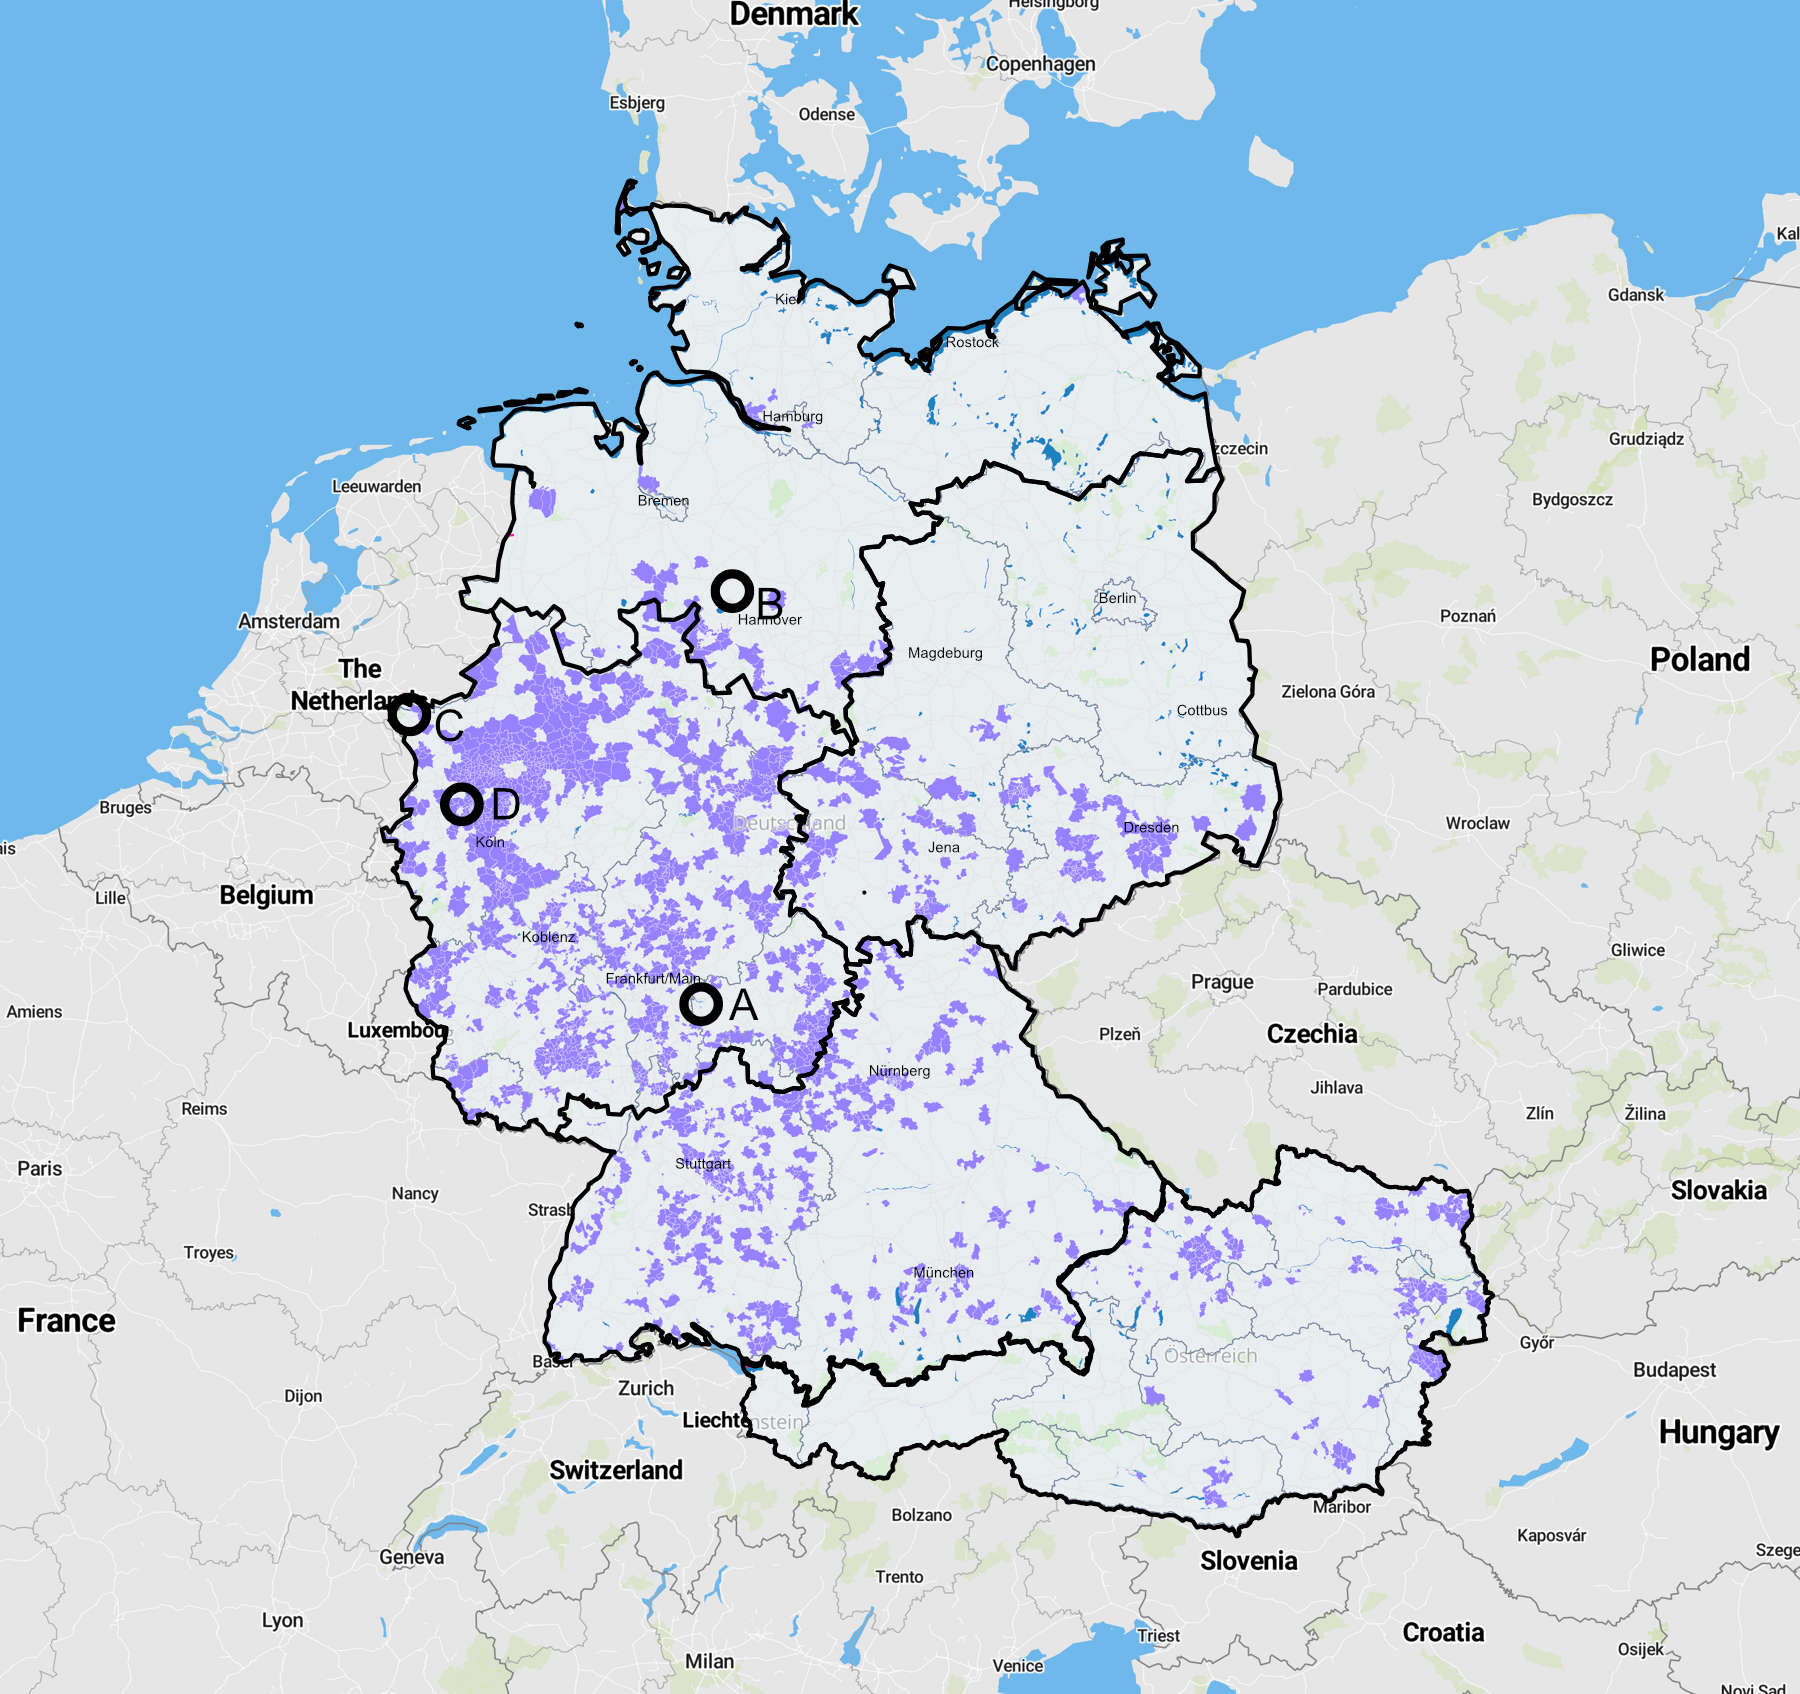
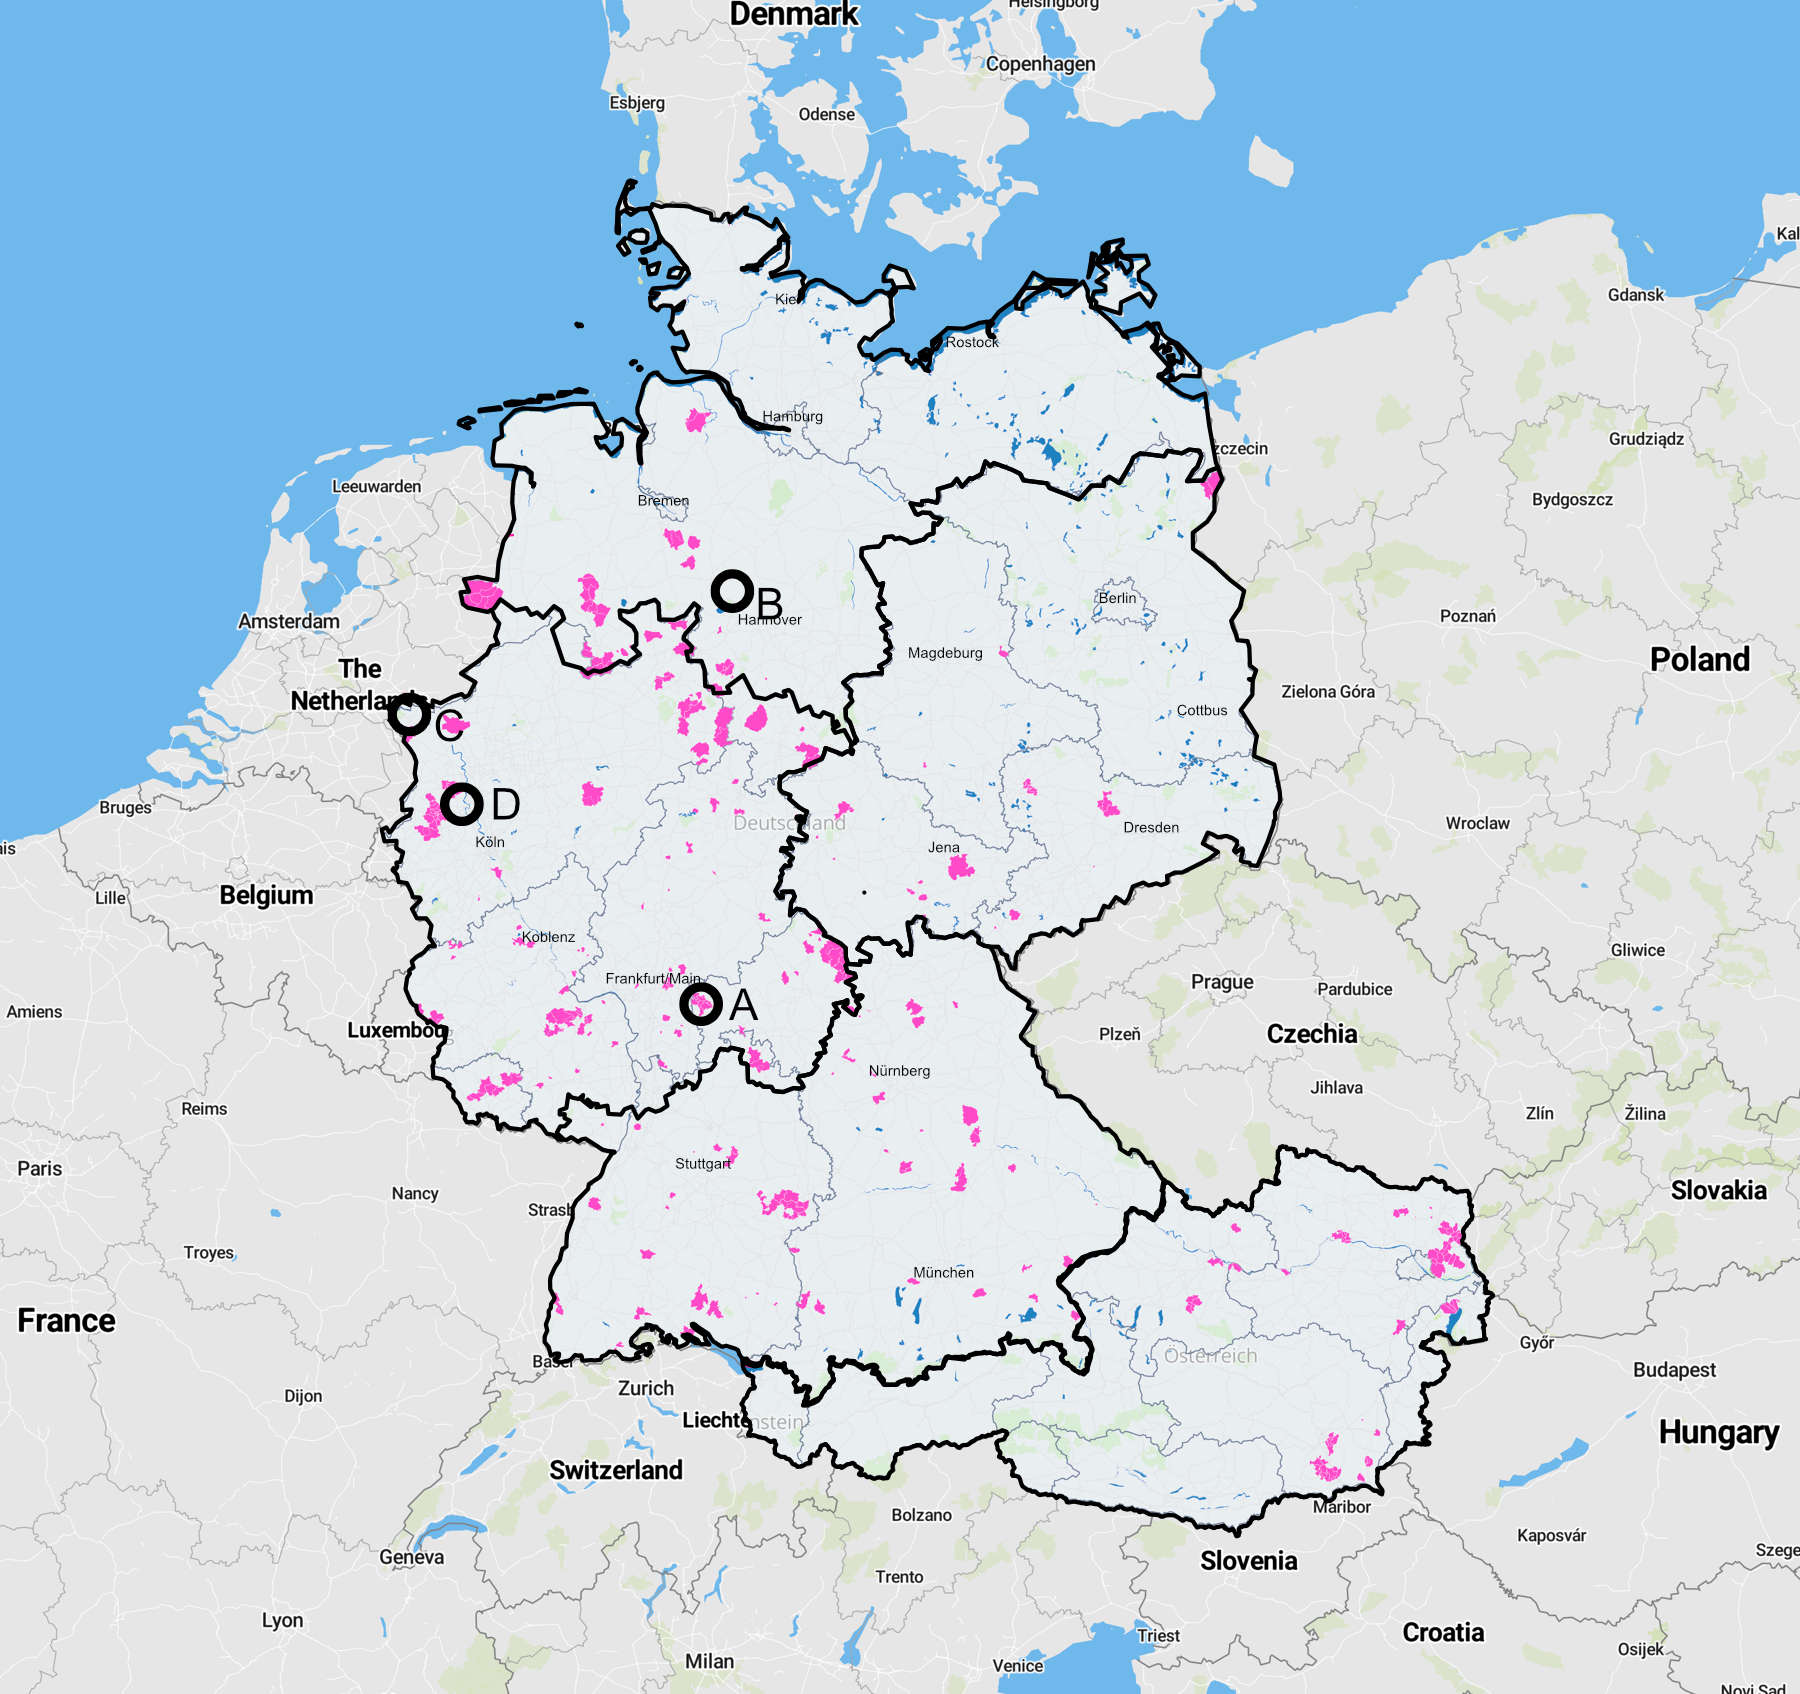
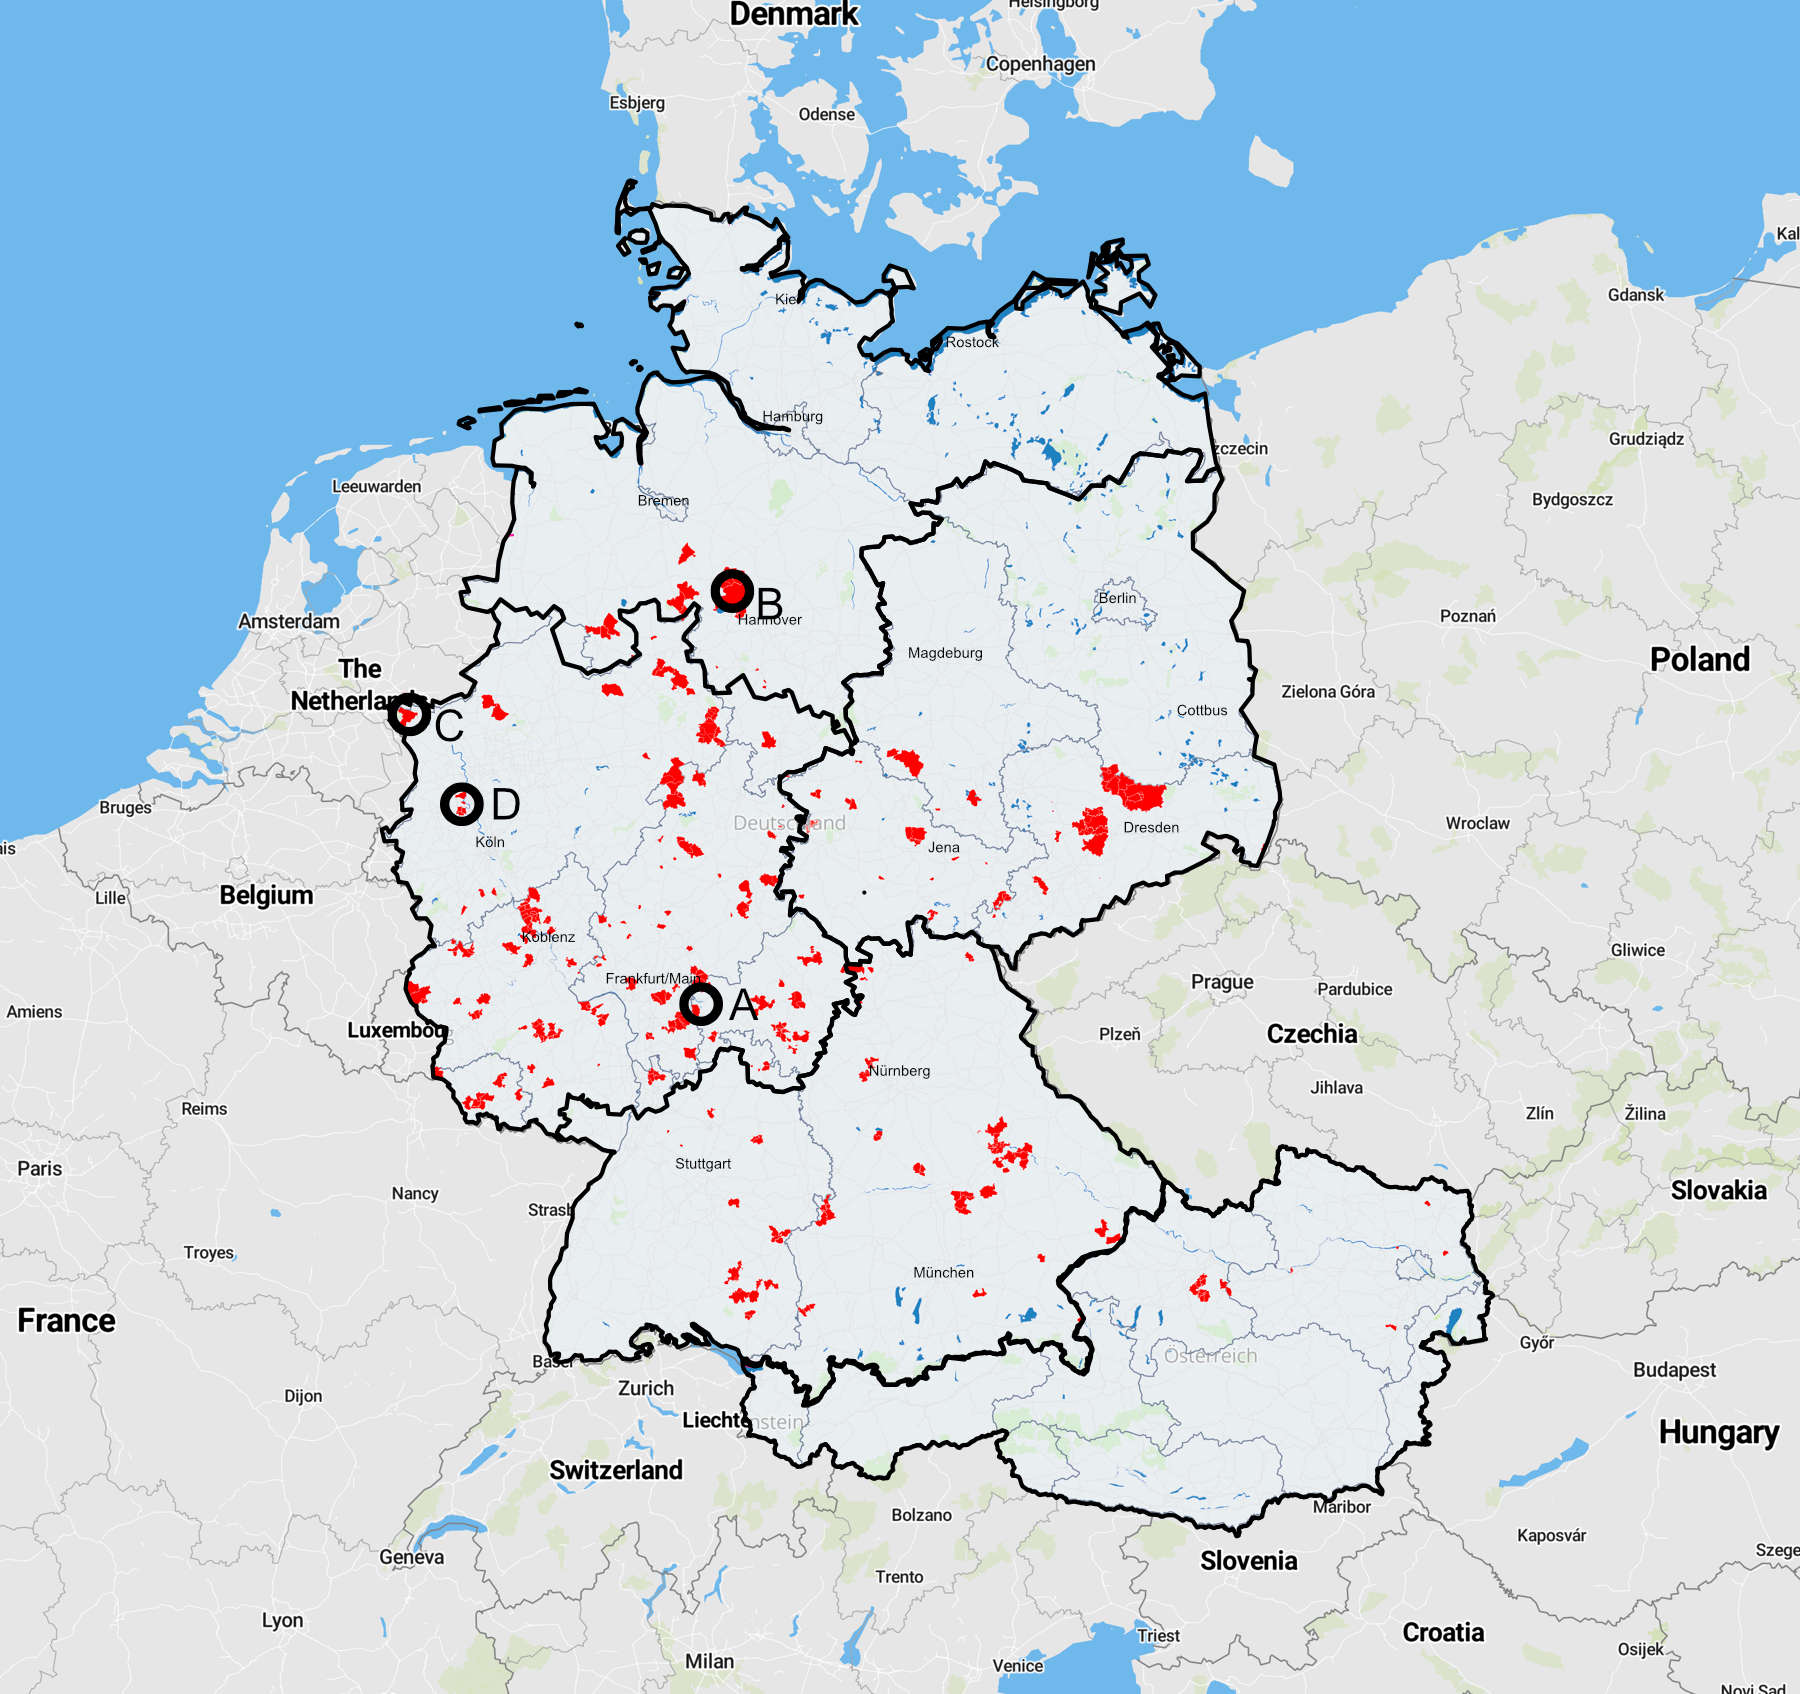
clockwise: all | <5mg/l | <10mg/l | <25mg/l | <35mg/l | <50mg/l
(Dataset: July 2019 - click to enlargen)
Historical data
As our database was only set up at the end of 2016 and therefore no older data is available to us, we have requested analyses from the last 10 years from various water suppliers that have shown particularly high nitrate levels in their analyses.
As only very few water suppliers responded to our enquiry, it is not possible to read out a reliable trend here, but we would nevertheless like to publish it here, also to show how important it is to record the nitrate concentrations in drinking water over a longer period of time.
In one case, the supply zone is divided into a southern and northern zone, one with an average nitrate content of 18 mg and one with a very high nitrate content of 42 mg. It is interesting to note here that the zone with a lower average nitrate content recorded a significantly greater increase than the zone with a high nitrate content.
| Zone A | Zone B | Zone C | Zone D Nord | Zone D Süd | |
|---|---|---|---|---|---|
| 2010 | 24 | 30 | 43 | 37 | 12 |
| 2011 | 26 | 33 | 40 | 41 | 15 |
| 2012 | 29 | 38 | 42 | 41 | 16 |
| 2013 | 27 | 39 | 44 | 39 | 16 |
| 2014 | 29 | 37 | 39 | 39 | 16 |
| 2015 | 29 | 40 | 43 | 41 | 15 |
| 2016 | 29 | 37 | 42 | 41 | 16 |
| 2017 | 27 | 39 | 44 | 43 | 16 |
| 2018 | 27 | 40 | 43 | 41 | 17 |
| 2019 | 30 | 42 | 40 | 42 | 23 |
| 2020 | 25 | 36 | 39 | 41 | 22 |
| Increase | 14% | 20% | -10% | 10% | 76% |

Summary of the results
In Germany and Austria, drinking water currently has low nitrate levels of less than 10mg/l for over 60% of the population and, according to the German Federal Office for Risk Assessment, is generally also suitable for the preparation of infant formula.
Taking the above-mentioned studies into account, we believe it makes sense to also report nitrate values below 5 mg/l separately.
It is very clear that particularly in northern Germany and the northern part of eastern Germany there are many regions with a very low nitrate content <10mg/l (90% of the population in northern Germany), while in the western federal states of North Rhine-Westphalia, Rhineland-Palatinate, Hesse and Saarland drinking water with this low nitrate content is only available to 40% of the population.
At the same time, around 20% of the population in these German federal states are exposed to nitrate levels of more than 20mg/l (Germany and Austria excluding northern Germany: 10%, northern Germany 3.5%).
The few historical data available to us from the last 10 years are not sufficient for a statistical evaluation, but in conjunction with the increase in the exceedance of nitrate limits in groundwater, they allow us to assume that no improvement in the current status of drinking water is to be expected in the coming years.
In order to enable a more precise categorisation of the health risk in Germany and Austria, further studies should be carried out in the future, especially in Germany and Austria. This should also be done with a view to evaluating the resulting costs for the healthcare systems of the individual regions.